Learn · 10 min read
Market cycles: how leadership, breadth and sentiment rotate
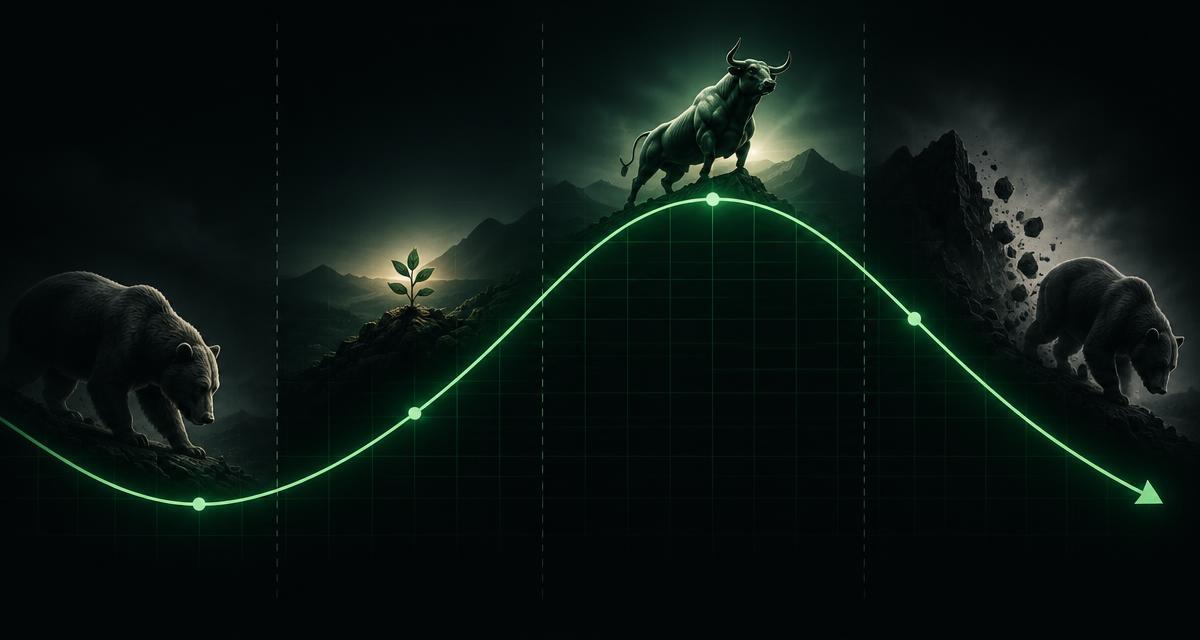
Cycles do not repeat on a schedule, and nobody rings a bell at the turns. What does repeat is the pattern: leadership rotates, breadth widens then narrows, and sentiment travels from pessimism to euphoria and back. John Templeton's description still fits — bull markets are born on pessimism, grow on skepticism, mature on optimism and die on euphoria. Knowing roughly where you are is more useful than predicting what comes next.
The four phases
Early cycle — recovery
- Sentiment:
- Pessimism. The news is still bad and the data is still weak.
- What tends to lead:
- Economically sensitive areas typically lead first: consumer discretionary, industrials, financials and small caps. Rate cuts from the previous slowdown are still working through the system.
- The tell:
- Breadth improves before the headlines do — more names participate in each advance, even while sentiment stays negative.
Mid cycle — expansion
- Sentiment:
- Skepticism giving way to confidence. Earnings do the heavy lifting.
- What tends to lead:
- Technology and capital-spending beneficiaries tend to lead as companies invest. Returns in this phase come mostly from earnings growth rather than from a rising multiple.
- The tell:
- Advances are broad and orderly. Volatility is low and clustered in short, forgettable episodes.
Late cycle — maturity
- Sentiment:
- Optimism turning into euphoria. Every dip is bought quickly.
- What tends to lead:
- Energy, materials and other inflation-sensitive sectors often lead as costs rise; defensives quietly begin to outperform on a relative basis.
- The tell:
- Leadership narrows to a handful of very large names while the average stock stalls. The yield curve flattens or inverts.
Contraction — the drawdown
- Sentiment:
- Fear, then capitulation. Forecasts are cut after prices fall, not before.
- What tends to lead:
- Staples, utilities, health care and cash-like assets hold up best. Leverage, not fundamentals, usually decides which businesses are permanently damaged.
- The tell:
- Volatility spikes hard, correlations converge, and diversification across similar drivers stops helping.
These are tendencies, not rules. Rotation is a description of past cycles, and each cycle has arrived with a different mix of policy, inflation and technology behind it.
Five signals worth reading
- 1
Breadth: how many stocks are actually participating
An index can rise while most of its members fall. Narrow leadership means the average holding is already in its own downturn, and it makes an index look healthier than the market underneath it.
- 2
The yield curve's shape
A normal curve slopes upward — longer commitments pay more. An inverted curve pays less for longer commitments, which historically has preceded slowdowns. The 10-year yield also sets the discount rate applied to every future cash flow, which is why long-duration growth stocks react hardest when it moves.
- 3
Where returns are coming from
Separate earnings growth from multiple expansion. A market rising on multiple alone is borrowing return from the future; a market rising on earnings is being paid for something real.
- 4
Volatility regime
Volatility clusters. Long calm stretches are followed by spikes rather than by more calm, so a quiet market is not evidence that risk has gone away — only that it has not been priced recently.
- 5
Drawdown math
A 20% decline needs a 25% gain to recover; a 50% decline needs 100%. This asymmetry is why the goal through a contraction is avoiding permanent impairment, not calling the bottom.
What past cycles actually taught
Black Thursday begins the crash
Margin debt turned a correction into a catastrophe. Leverage decides how far a decline goes.
The Great Depression low
The Dow closed at 41.22, roughly 89% below its 1929 peak. Every recovery in market history began at a level nobody wanted to buy.
Black Monday
The Dow fell 22.6% in a single session — the worst one-day percentage loss ever — yet finished the year roughly flat. Speed of decline is not the same as duration of damage.
The Nasdaq peaks at 5,048
It took about 15 years to reclaim. Great themes and great prices are not the same thing.
The financial-crisis bottom
The S&P 500 closed at 676 and began one of the longest bull markets in history. The best entry points feel like the worst days.
The S&P 500 reclaims its 2007 high
About five and a half years of waiting closed the gap. Patience, not prediction, did the work.
The fastest bear market on record
A near-3,000-point Dow session on pandemic fears was recovered within months. Reaction speed and outcome quality are unrelated.
How to use a cycle read
A cycle read is context, not a trigger. It should change how much risk you are willing to carry and how much you are willing to pay — not whether you are invested at all. Far more money has been lost by investors preparing for corrections than in the corrections themselves.
Use it as a checklist question before each decision: is this thesis relying on the phase continuing? A position that only works if late-cycle enthusiasm persists is a different risk from one that works across phases, even if both look identical on a chart today.
And diversify across drivers rather than across names. Twenty holdings exposed to the same interest rate, the same customer or the same sector behave like one position in the phase that hurts them.
Continue with trading psychology and ai investing.
See the cycle in live market data
Ticker-Terminal tracks the S&P 500, Nasdaq, Dow, VIX and the 10-year yield alongside sector exposure and AI research on any US-listed stock or ETF. Free plan includes three AI research analyses a week.
Free guide series
Get the “how to research a stock” checklist
Two emails. The 7-step checklist now, then the next guide in the series — starting with Which AI is best for stock research.
- The 7-step “how to research a stock” checklist, sent immediately
- The next recommended guide in the series, two days later
- Occasional new guides only — no daily market noise, unsubscribe in one click