Learn · 10 min read
Trading strategies explained: day trading, swing trading and long-term investing
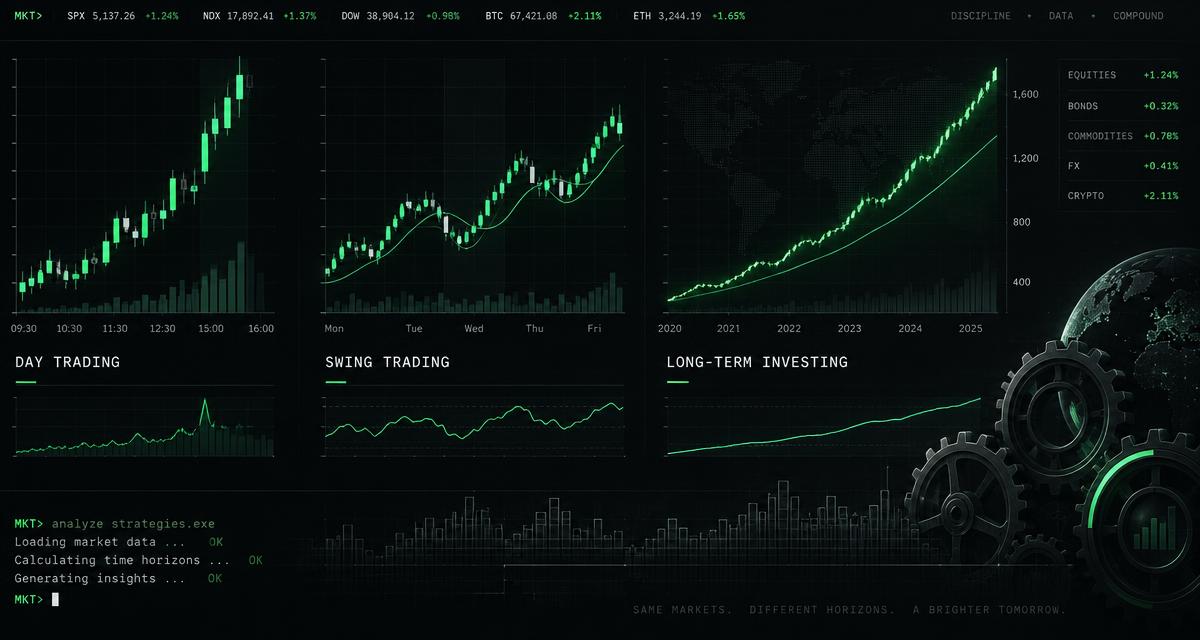
Most investors do not fail because they picked the wrong asset. They fail because they applied a time horizon, risk level and toolset that did not match their schedule, temperament or capital. Day trading, swing trading and long-term investing are not better or worse than one another — they are different games with different rules. This guide compares each strategy honestly so you can choose the one you are most likely to execute well.
Day trading
- Time horizon:
- Hours — positions are opened and closed within the same market session.
- Goal:
- Capture small, frequent price movements by reacting to intraday momentum, volume and order-flow signals.
What traders typically watch
VWAP
Volume-weighted average price — shows whether the current price is rich or cheap relative to the day's trading.
EMA 20
A responsive moving average that tracks short-term trend direction on a 1-minute to 15-minute chart.
RSI
Relative Strength Index — flags short-term overbought or oversold conditions.
Volume
Confirms whether a breakout or reversal has genuine participation behind it.
Risks to respect
- Requires full attention during market hours and strict stop-loss discipline.
- Transaction costs and slippage compound quickly with high frequency.
- Emotional decision-making is magnified by compressed time frames.
Who it fits
Best for traders who can monitor markets live, control position size tightly, and treat trading as a focused activity rather than a side hobby.
Swing trading
- Time horizon:
- Days to weeks — trades are held across multiple sessions but rarely for months.
- Goal:
- Profit from intermediate price swings within an established trend or around identifiable support and resistance levels.
What traders typically watch
MA 20 & MA 50
Two moving averages that define the near-term and intermediate trend; crossovers and pullbacks to these levels become decision points.
MACD
Moving Average Convergence Divergence — measures momentum and trend strength, useful for spotting continuation or exhaustion.
RSI
Helps identify when a swing has moved too far, too fast and may be due for a pause.
Volume
Breakouts above resistance or breakdowns below support should be accompanied by above-average volume.
Risks to respect
- Overnight and weekend gap risk can move prices past stop levels.
- Holding through earnings or macro events can produce sudden volatility.
- Requires patience to let setups form and discipline to exit when they invalidate.
Who it fits
Best for active investors who cannot watch screens all day but can review positions and charts every evening or weekend.
Long-term investing
- Time horizon:
- Years — positions are sized around business quality, earnings growth and compounding.
- Goal:
- Build wealth by owning productive assets and letting earnings, dividends and time do the work.
What traders typically watch
MA 50 & MA 200
Long-term trend filters that help distinguish a durable bull market from a cyclical top.
Fundamentals
Revenue growth, margins, return on invested capital, free cash flow and balance-sheet strength.
Valuation
Price-to-earnings, free-cash-flow yield and growth-adjusted multiples — compared to history and peers.
Macro context
Interest rates, inflation and the earnings cycle shape which businesses thrive over multi-year periods.
Risks to respect
- Concentration in a single theme or stock can overwhelm diversification benefits.
- Behavior risk — selling during drawdowns converts temporary declines into permanent losses.
- Time horizon must genuinely be long; early withdrawals force sales at random prices.
Who it fits
Best for investors who want to spend most of their energy on business selection, portfolio construction and periodic rebalancing rather than timing every move.
At a glance: how the three styles compare
| Dimension | Day trading | Swing trading | Long-term investing |
|---|---|---|---|
| Typical holding period | Minutes to hours | Days to weeks | Years |
| Primary edge | Speed & execution | Pattern & momentum | Business quality & compounding |
| Key tools | VWAP, EMA, RSI, volume | MA, MACD, RSI, support/resistance | Fundamentals, valuation, macro |
| Time required | High — live market hours | Moderate — daily review | Low — periodic research |
| Cost sensitivity | Very high | Moderate | Low |
| Main risk | Slippage & emotional mistakes | Gap risk & overnight events | Behavior risk & concentration |
Which style should you use?
The right answer is usually the one you can repeat consistently. If your job prevents you from watching markets during the day, day trading is a poor fit regardless of how attractive the profits look. If you cannot sleep with a 20% drawdown, long-term equity investing will test you until you either sell at the wrong moment or adjust your position sizes.
Many successful investors combine approaches. A long-term portfolio provides the core wealth engine, while a smaller swing or options account satisfies the desire to act on shorter-term setups. The important rule is to keep the accounts mentally separate: do not turn a short-term trade into a long-term hold because it went against you, and do not sell a long-term position because of one noisy afternoon.
Risk management is the real strategy
The labels "day trader," "swing trader" and "investor" matter far less than position sizing, stop criteria and review habits. Every style loses money when position sizes are too large, theses are vague, or emotions override plans. Before you commit to a style, commit to a written rule for how much capital you will risk on any single idea and what conditions will force you to close it.
How Ticker-Terminal supports each style
Day traders can use Advanced Charting with VWAP, EMA and RSI presets on sub-minute intervals, alongside real-time market data and live index quotes.
Swing traders get trend, momentum and support/resistance presets on daily charts, plus earnings calendars and trending-news context for timing catalysts.
Long-term investors receive AI research reports, valuation models, 12-month forecast scenarios, portfolio heat maps and position-sizing guidance built from verified fundamentals.
Free guide series
Get the “how to research a stock” checklist
Two emails. The 7-step checklist now, then the next guide in the series — starting with Which AI is best for stock research.
- The 7-step “how to research a stock” checklist, sent immediately
- The next recommended guide in the series, two days later
- Occasional new guides only — no daily market noise, unsubscribe in one click